Data collection
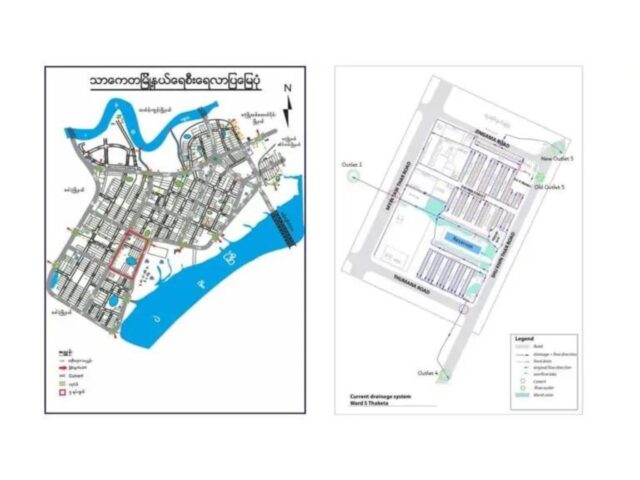
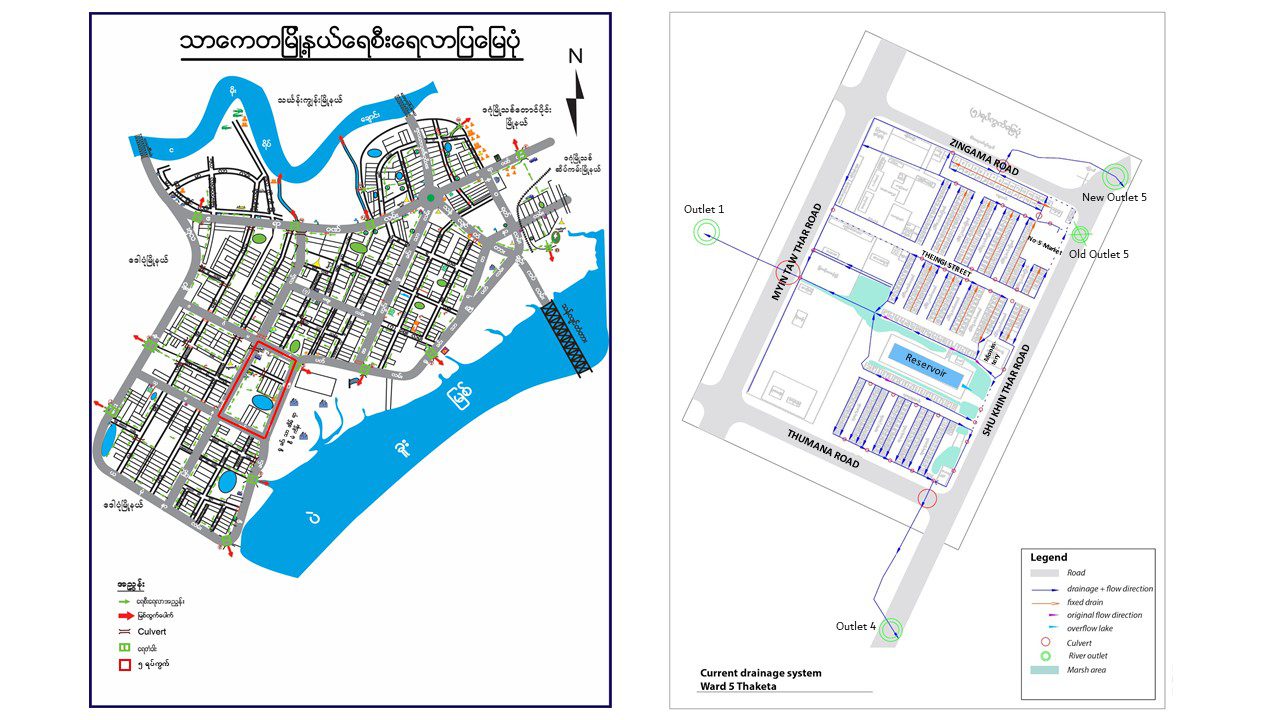
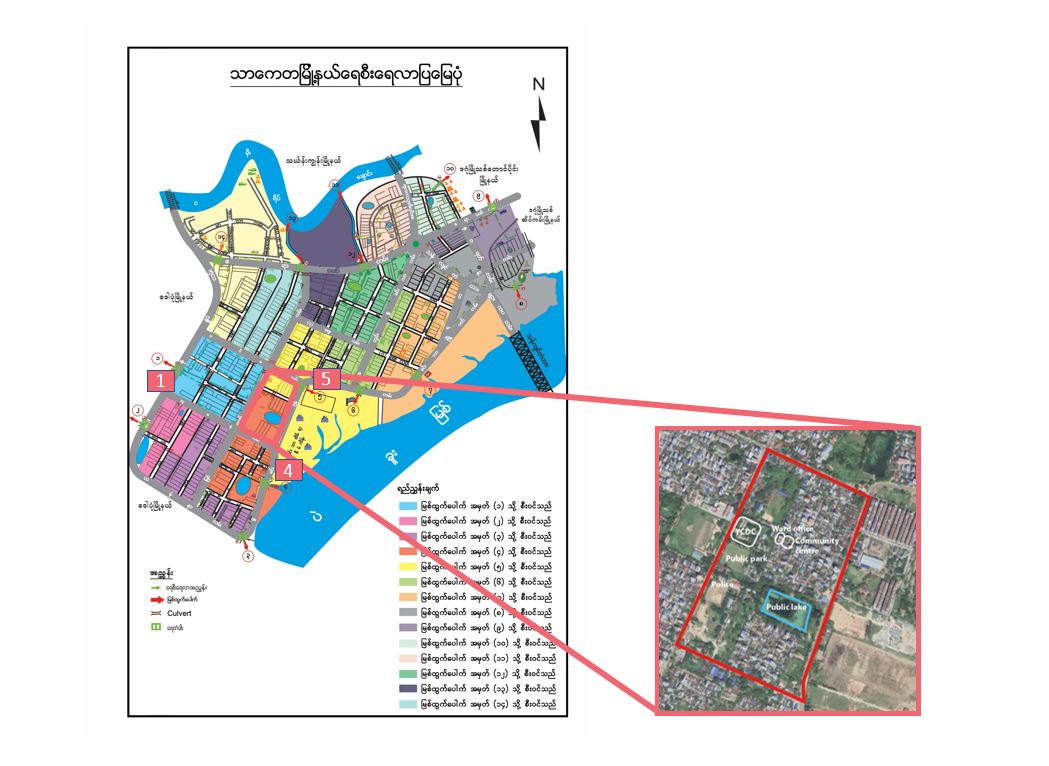
During the first phase of the project, we gathered information through engagement with the Ward Officer, YCDC and residents on the existing drainage systems within the Thaketa township as well as of Ward 5. This information served as a starting point for discussions with residents and YCDC on possibilities to improve the drainage system. The following maps are based on this first data collection:
Check the conditions of the current drainage system and catchment info here and here.
In the second phase, the project team conducted a measurement campaign, to gather qualitative data on the drainage system such as depth of the drainage channels and the current slope. For more information on this measuring campaign, see here.
Next to information collected from YCDC and field work, we were also able to work with useful data from Yangon Flood Model (YFM) that was shared by YCDC to us. Yangon Flood Model is a flood hazard and risk model developed by Royal HaskoningDHV Co., Ltd. to support YCDC with the help from the Netherlands Government Agency (RVO). The data from YFM that we mainly used for our analysis of the drainage system are:
- LIDAR data, which is a high resolution topography map of Yangon
- Observed and analysed rainfall data for Yangon
- Simulated river water levels
Last but not least, we also asked the residents about their experience with flooding.
Analysis: description of the drainage system
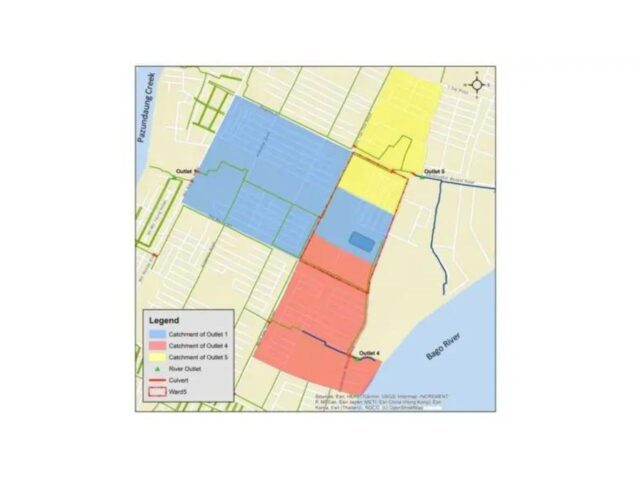
According to the drainage map from YCDC, the water from Ward 5 originally flowed from the ward to two main river outlets: outlets no. 4 and 5. The outlets and the related catchment areas are shown in the following map:
These catchments, however, are no longer correct for Ward 5. Because of the new developments and urbanization, the flow directions have changed – the middle part of Ward 5 is now part of the catchment area of outlet 1 (the blue area); see also the map (Figure 4) below.
Water from the blue area (Figure 4) of the ward flows into Outlet No.1. This outlet is not fully functioning because of issues with waste and sedimentation and operation issues: i.e flap gates are not closed when the tide comes due to the discussion issue with another ward (ward in Dawbon township) and only two gates are functioning.
Water from the red area (Figure 4) of the ward (Thumana Sector) flows into Outlet No.4, after passing through the box culvert. Drains toward outlet 4 and inflowing perpendicular drains are generally in poor condition and do not have enough capacity. Some sections are being blocked by either driveways or constructions. There is also a tidal influence from the Bago riverside, which leads to sedimentation between the culvert and outlet.
Water from the yellow area (Figure 4) of the ward (North Sector) flows into the new Outlet No.5. The old outlet was blocked by a housing project and the new one is functioning quite well. Its capacity and level are okay and there is also no tidal influence. There is only an issue with waste and vegetation in itself. But the drains in the ward and the culvert towards that outlet are full of waste and sediment.
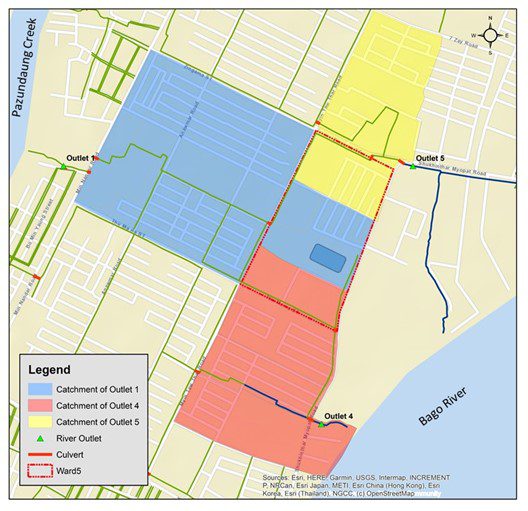
In Figure 4 the current catchment areas of outlet 1 (blue) and outlet 4 (red) are shown. These are based on catchment maps provided by YCDC (as shown before) and discussions during the project on the current drainage system. These two catchment areas are analyzed in more detail as here the main challenges can be found.
Analysis of the functioning of the main drains and outlet (1 and 4):
The current outlets have the following dimensions (see table below). The carrying capacity of the outlets is based on the current design, see table 1.
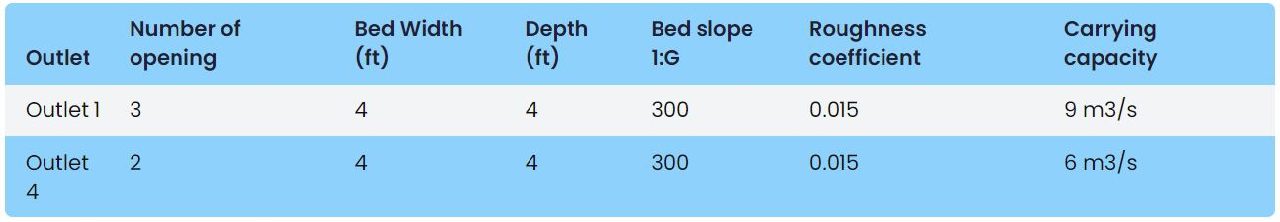
Note that the current capacity is estimated assuming that there is no constraint in upstream and downstream water levels in the rivers caused by high and low tide. This means that the actual capacity of the outlets is lower, as they cannot always drain towards the river during high tide. To take this into account, the drains ideally should be overdimensioned, so they can buffer the water as long as it cannot be drained to the river.
Moreover, for both outlets the current capacity is limited due to accumulation of solid waste and vegetation and flap gates are not fully functioning. For outlet 1, currently only 2 of the 3 openings are fully functioning. In the calculation we assume the 3 openings are operational.
This current capacity of outlet 1 can be related to a rainfall intensity of 44 mm/hour (catchment area of 92 ha and a runoff coefficient of 0.8). This current capacity of outlet 4 can be related to a rainfall intensity of 72 mm/hour (catchment area of 37 ha and a runoff coefficient of 0.8). These rainfall intensities coincide roughly with a return period of approximately 1 year.
What is the current capacity of the drainage system?
This depends on the capacity of the outlet and the drainage system.
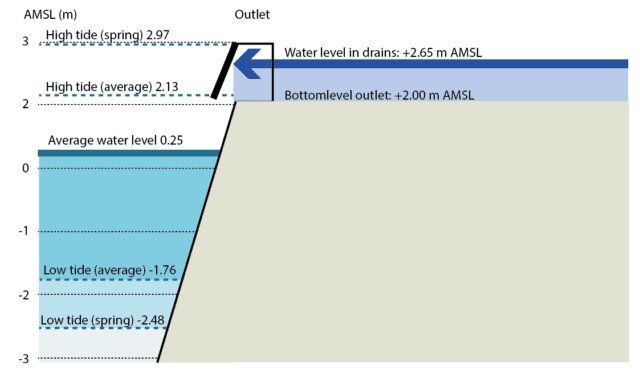
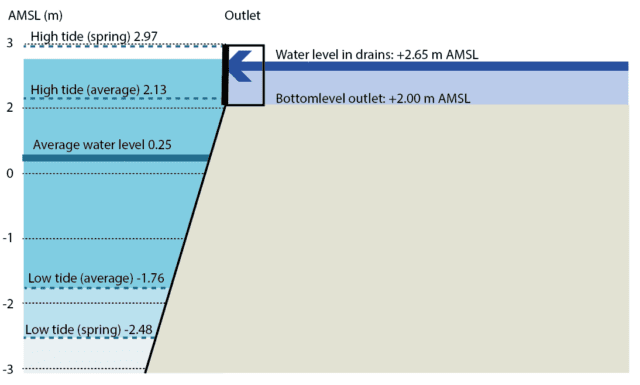
Example outlet 1:
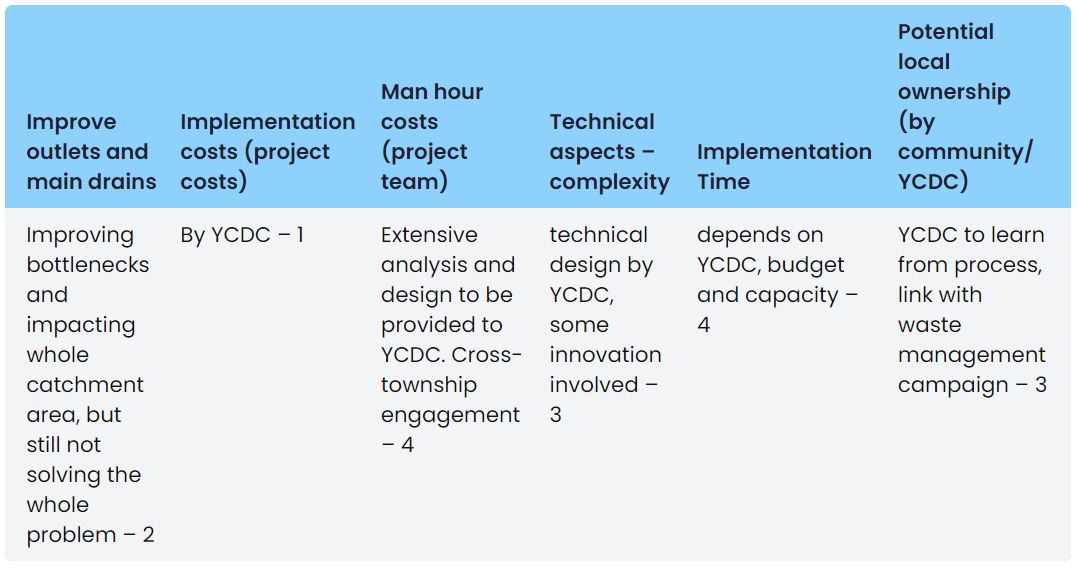
Multi Criteria Analysis