To create new buffer areas, hydrological data is needed: how much water are we dealing with? What are the rain patterns, what are the tidal patterns and how do they coincide?
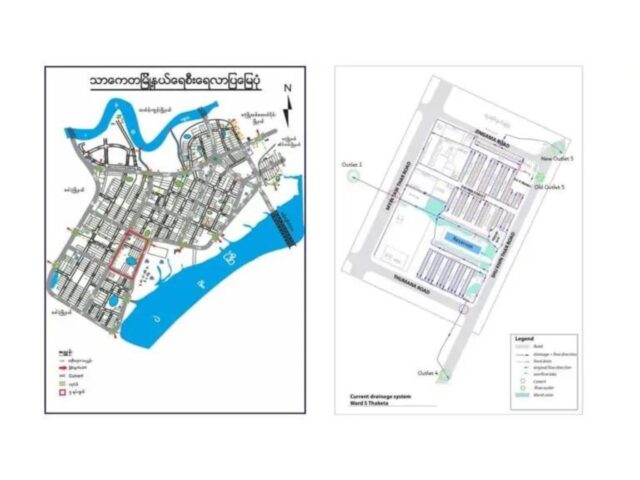
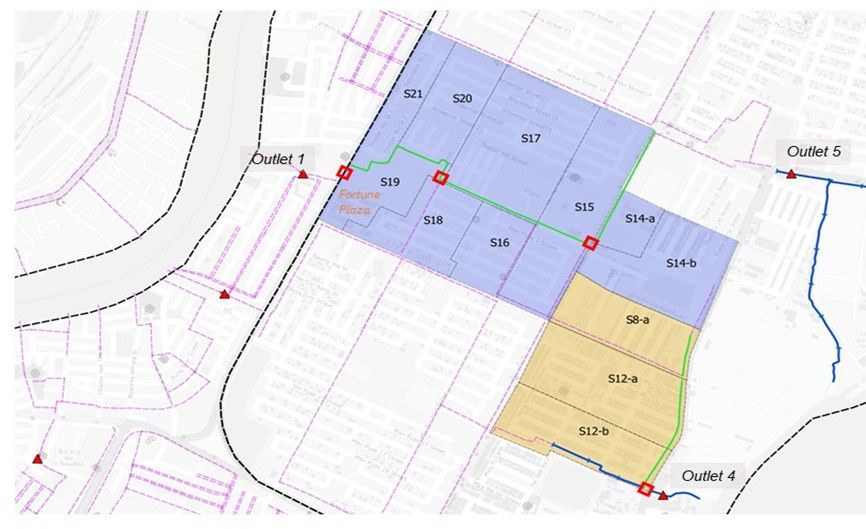
It is important to get a good understanding of the current drainage system and its limitations. In the case of ward 5, we started collecting data via the ward officer and the drainage officer. A very basic map was the starting point (See here).
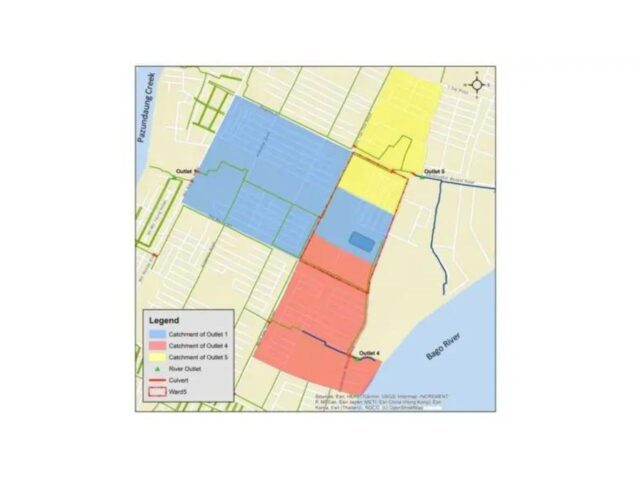
Discussions with the drainage officer (for the larger drains, culverts and outlets) and the ward officer (smaller drains, back alley drains, and info on the current status of drains) helped get a better picture of the system.
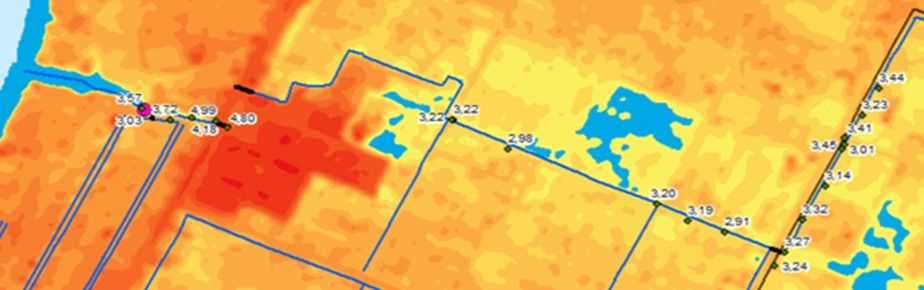
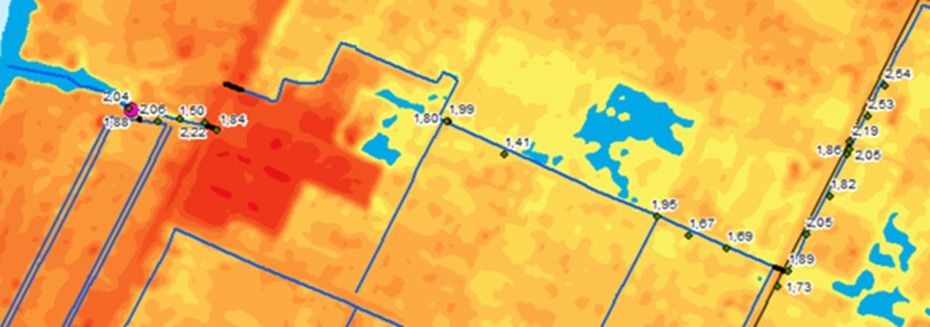
The analysis of the current drainage system is based on maps and on field measurements (see also here). The following steps were followed:
- Bed level of the drains (numbers on map)
- Maximum water level in drains without overflow, leading to inundation surrounding areas
- on map in blue the area lower than 2.85 m AMSL; lowest area that is physically connected to the drains is 2.85 m AMSL (visual assessment) – as long as water stays then that no inundation will take place
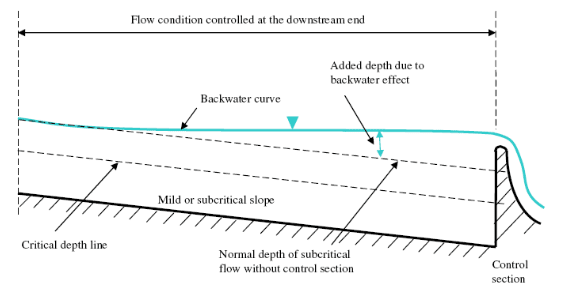
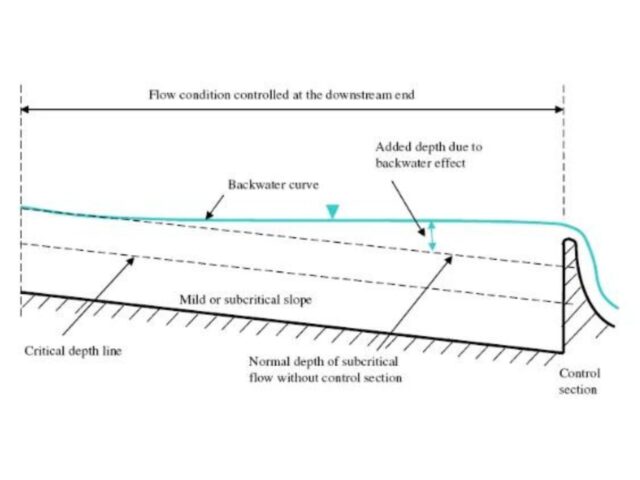
- take into account ‘back water curve’ – water (caused by culverts and outlet (‘opstuwing’))
- water level upstream of outlet 1 must be below 2.65 m AMSL
- on map: bank level in AMSL