Process Overview of the Measurement Campaign
Zoning the Measurement Area
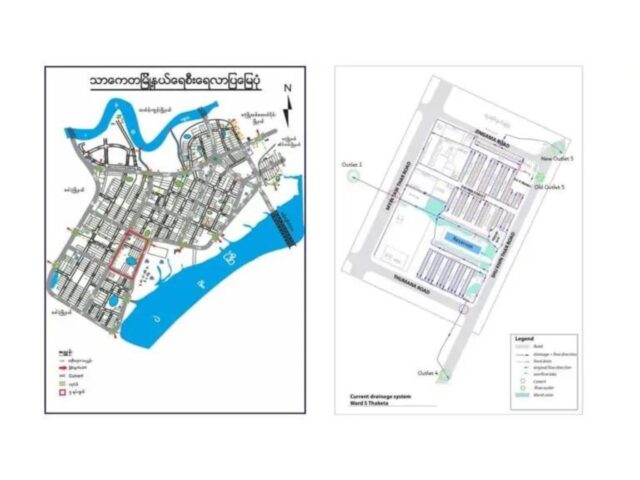
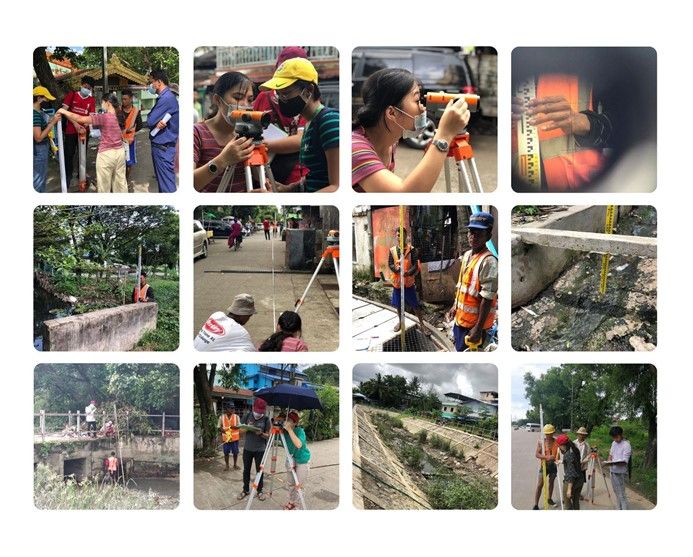
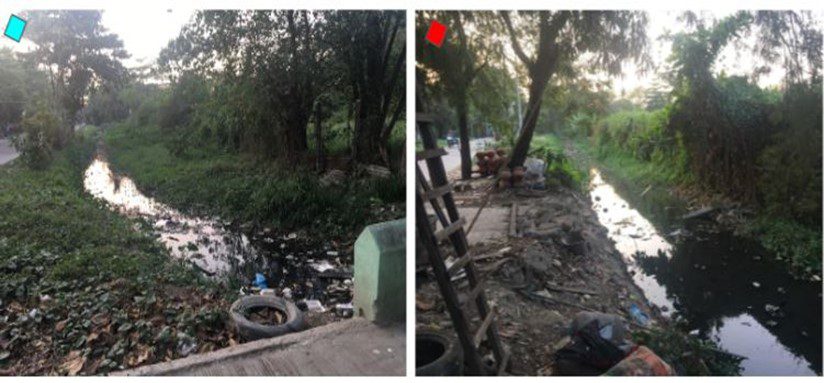
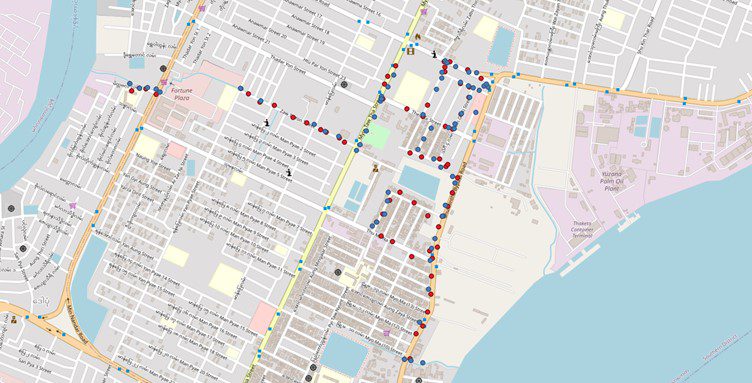
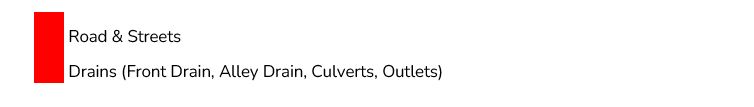
The measurement team took four days to cover and measure all the focused areas and locations throughout the Thaketa Ward-5. Firstly, the Thaketa ward-5 overall measure layout map was developed by overlaying the highly potential focused point on the existing drainage map. This map covers all the sectors throughout the ward-5, including the drains on the main road that flows toward each of the outlets in their respective location, the ward level drains at the front (streets) and in the alley, possible wadi locations (i.e low-lying areas generally forming as swamps) and finally the mash/dike area right next to the reservoir, which is a significant water body and surface water source for the whole ward-5.
Internal Training to Core Measurement Team
Before the actual measurement, one senior technical advisor gave a one-day measurement training to the core measurement team including the theory of levelling, the usage of devices, overall processes, etc.
Training to Volunteers & Drainage Department Staff Each day about 15 -30 minutes before starting the measurement, the lead of the core measurement team explained the overall process and agenda of that measurement day such as the objective of the process, the basic information of the drainage system including the zoning map and how the route is planned to measure, how to read the ruler & how to note down on a spreadsheet, how to handle the devices while moving and setting up and sharing some cautions.
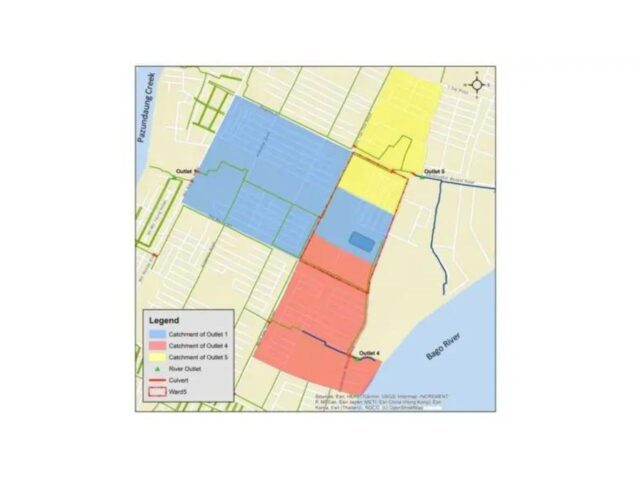
For the on-ground measurement, the ward was divided into three zones and at first, the team planned to carry out and finish the measurement of each zone for one day. But it took four days with some added measurement.
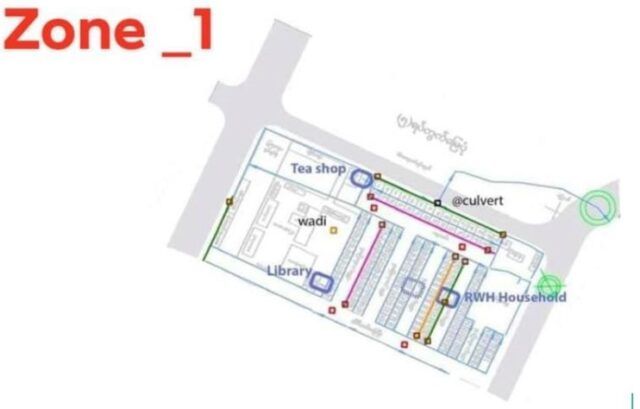
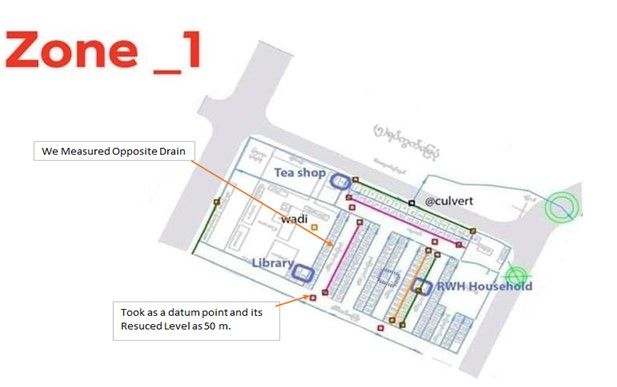
Zone 1 is the north part of the ward (Theingi North Sector) and the team could manage to measure all the points on the map completely on the first day (22nd July 2020) except for the wadi area since it is located in the school compound and the team could not access to that place and it is also away from the line of sight. Furthermore, this campaign is more focused on the drainage conditions and so, because of such challenges in measuring, the team decided not to conclude this wadi area in the measurement.
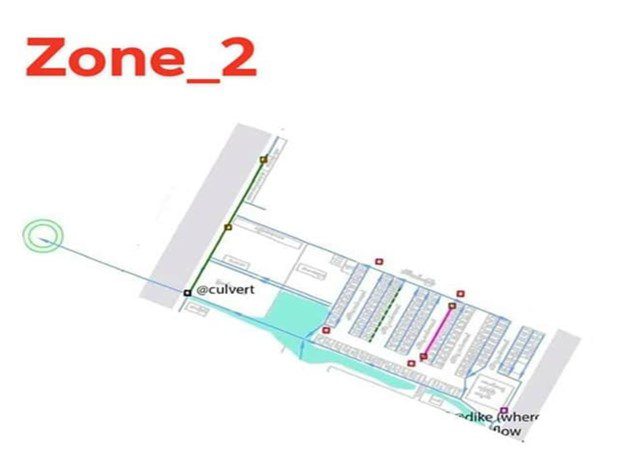
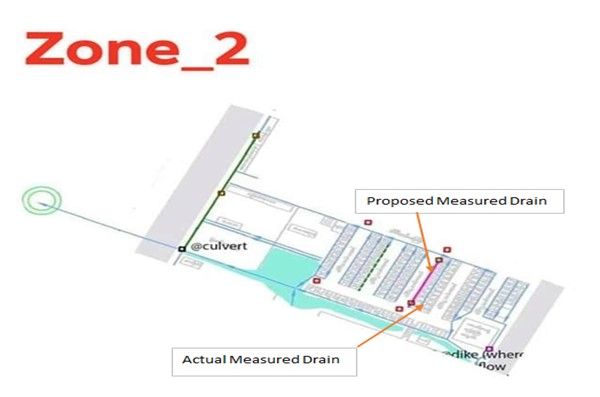
Zone 2 is the middle part of the ward (Theingi South Sector) and in that case, the team could not manage to measure all the points on the map in just one day (24th July 2020) since outlet 1, where all the water from the middle sector of Ward 5 flows towards is far from the ward area. Therefore, the team had to measure all the routes towards the outlet in order to not miss out on the connection between measured points and it took some more time. So, on the second day, the measurement was done about 75% of the work.
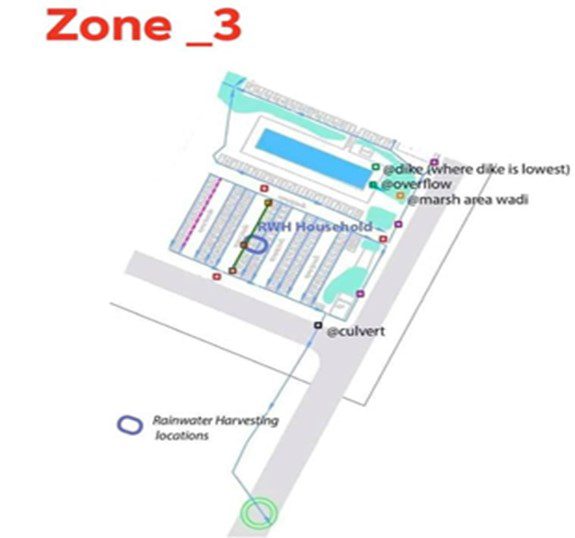
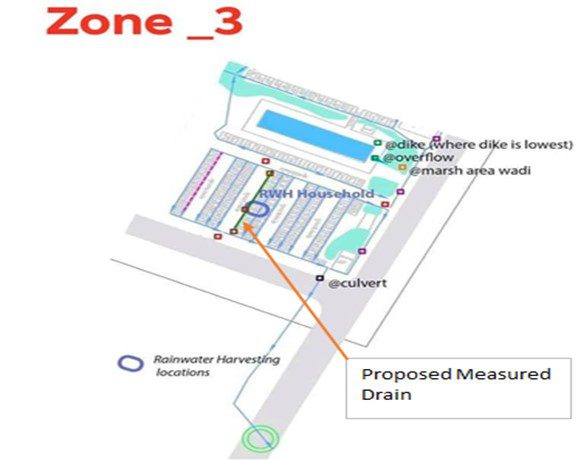
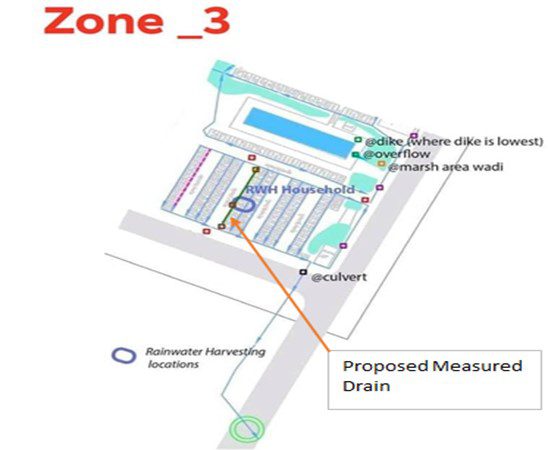
Zone 3 is the southern part of the ward (Thumana Sector) and the team measured the rest of zone 2 and this whole zone 3 in two days (27th & 31st July) and finished all the marsh area next to the reservoir, characteristics front and alley drain, the roadside drain alongside towards outlet 4 as well as the outlet-4 itself.
Collecting the data
The primary measuring components include:
- Level of the road
- Bank-level, bed level, width, the depth of water and silt of the drains, culverts and outlets.
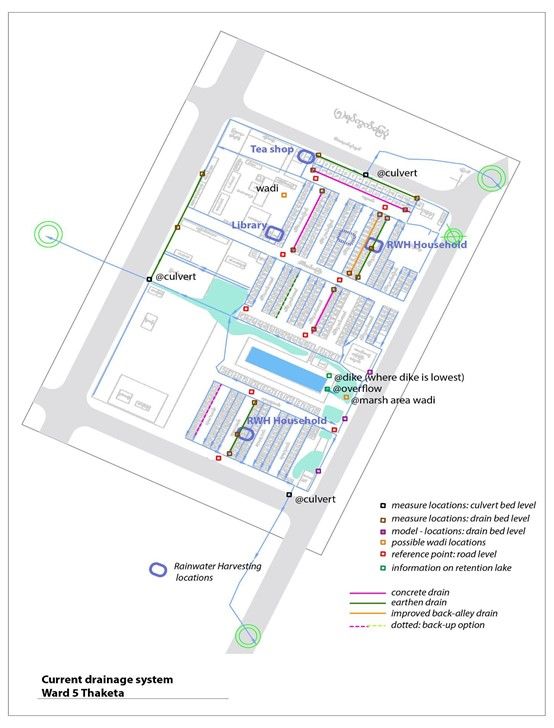
According to Figure 3.0, firstly, the measurement was started with a point on Theingi main road as an initial reference point (Reduced level of 50 m) of the whole measurement dataset, which will later be correlated to its true level by interpolating with LIDAR data of Myanmar (topographic data).
After the initial datum point, the other points were measured. At every position, the measurements were written down and a photo was taken in case of tracking back or matching back when needed, whilst sketching on the spreadsheet at the same time. The measurement includes:
- Latitude and longitude of the measurement point
- Backsight, Foresight, Intermediate sight
- Distance between tripod and reading points (BS &FS). We tried to keep those distances to be the same as much as possible to reduce measurement errors.
If it is the road: Level reading of the road, and if it is a drain or culvert or an outlet:
- Bank-level
- Bed Level
- Water depth & silt depth
- Width ( wider width and narrower width in case of trapezoidal drains, culverts and outlets)
- Significant remarks, etc.
Actual measurements vs. planned measurements

The initial datum point is set in zone 1 and because of the existing disturbance on the right side of Theingi North No-1 street which blocked the line of sight of the reading, the left side front drain was measured instead of the right side front drain as proposed in the zone 1 layout map.

When carrying out on-ground, there was no front drain on Theingi South No.3 Street. Thus, the alley drain right next to it was measured instead after discussing with the team.
Since some points of Outlet-1 and the long drain between ward 5 and Outlet-1 will be used in a later modelling process by the technical team (Link), the followings are the critical measure points of Outlet -1:
- Bed level of gates (preferably both middle one and one on the right)
- Level of the road on left/ southern side (can be correlated with LIDAR data)
- Bed level of two locations inside the drain
It was the same here in Zone-3, when carrying out on-ground, there was no front drain on Thumana No.2 Street and so we could not measure this.
The critical measured points of Outlet-4 are also as follows;
- Bed level of the drain at two or three locations
- Bed level of the culvert (if possible)
- Level of the road (correlate with LIDAR)
Developing Measured Reduced Level Dataset
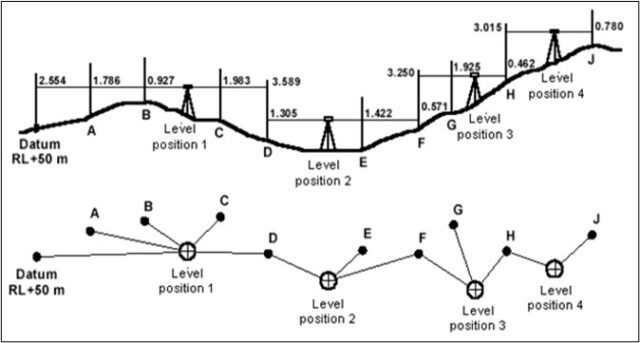
After all the measurements were done, all data was added into the format and the measured reduced levels were generated by using the height of collimation method.
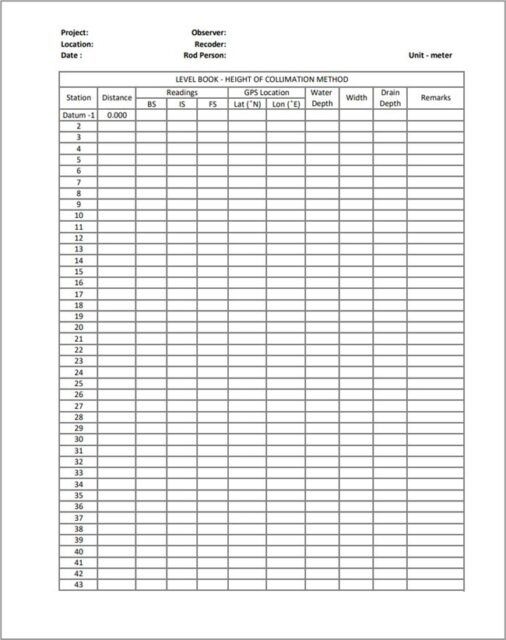
Calculation of reduced level
Reading on a point of known elevation is called backsight (BS)
- First BS reading + BM elevation (initial datum point) = HI (height of instrument)
Reading on a point of unknown elevation is called foresight (FS)
- HI – FS = elevation of new point
In this way, the new reduced levels of consecutive points were calculated.
Check:
- ∑BS – ∑ FS = Last RL – First RL
Error:
- Allowable Misclosure = 5 (N)1/2 mm
Generating true reduced level (Interpolating with LIDAR Data)
Then the whole dataset was correlated with LIDAR data for the actual outcome. To do this, free and open-source software called Quantum Geographic Information System (QGIS) was used. By overlaying the current map with the LIDAR Dataset, the true reduced level of the initial datum point was found. Therefore, that was input into the previous linked Reduced Level dataset and all the true Reduced levels of all measured points were generated.
Generating GIS shapefiles
With this true outcome of the reduced level dataset, attribute tables for each zone were prepared and then adding each table as a layer into the QGIS and generated point shapefiles for each zone as well as for the whole overall ward.
Findings of the Measurement Campaign
Zone 1
- For loop surveying, the reduced level of the reference point (initial datum point) deviates a little from the original benchmark of 50m which is within the allowable misclosure error.
- According to the result, the drain direction of Theingi North Street No 1 is the same as mentioned on the Map. (concrete drain)
- Drain on Market Street is lowering East to West which is opposite as mentioned on the Map
- Alley Drain between TGN 3 & TGN 2 Streets is flowing from South to North which is the same as mentioned in the Map
- But the Bed Level of the front drain on Theingi North Street No 4 is lowering from North to South which is opposite as mentioned on the map. However, the bed level rises again at the South end of the drain.
The bed level of the Main drain on Zingama Road is not stable. It is rising and lowering from point to point alternatively.
Outlet -5 (Culvert)
- The drain towards the culvert (Outlet-5) on Zingama Road is lowering and flowing right as proposed. But the culvert itself has a waste issue and is blocked by lots of trash and water couldn’t flow even though its reduced level is lower in the drain system of Zingama Road.
Zone 2
- According to the result, the direction of both front and alley drains are the same as mentioned on the map.
The main drain on Myin Taw Thar Road is normally flowing from North to South which is the same as mentioned on the map. But its bed level is not stable and instead of lowering along the flow direction, it rises again at some point. So, there may be a problem with water staying in the drain all around the season.
Outlet -1
- The bed level of the drain directing to outlet 1 is lowering along its direction. But, there are some points of their bed levels rise again.
- For outlet 1 itself, water flows only through the right gate. The bed level of the middle gate is slightly higher than that of the right gate.
Note: We couldn’t measure the drain that connects Fortune Plaza’s back gate and front gate as that portion is in the compound and we couldn’t access it there. But we saw the water flowing to outlet -1 and it is just the earthen drain.
Zone 3
- According to the resulting reduced levels, the direction of the drain on Thumana No 1 Street is lowering from North to South Direction which is the same as mentioned on the map.
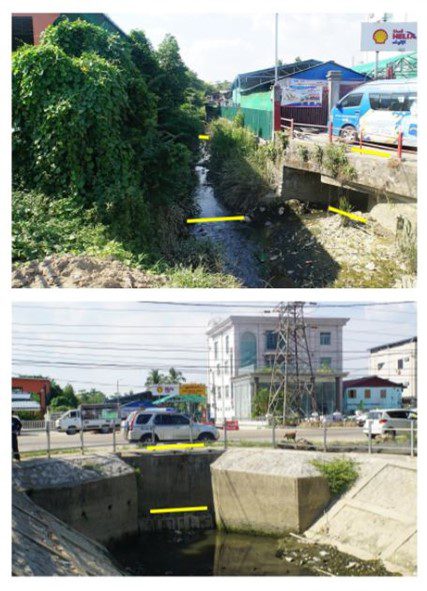
- The drain along the Shu Khin Tha Road is not continuous, and it was disturbed by some marsh/dike areas near the reservoir with a depth of around 5 feet.
Outlet – 4
- Along the Shu Khin Tha Road, the Bed Level of the drain is lowered each by each to outlet 4. So, we can assume that water from ward-5 is flowing to outlet 4.
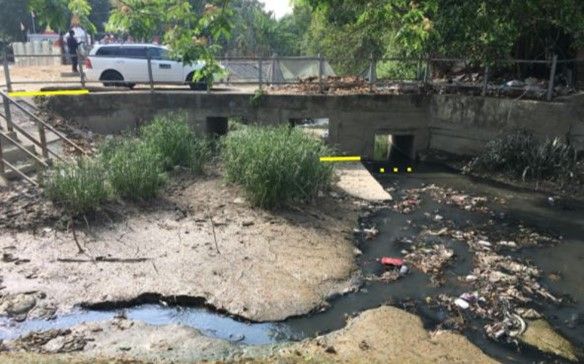
- The resulting reduced level along the outlet-4 is lowering in the right direction and finally flows to the Bago River. That means this outlet-4 is good enough in the flow direction. But there is some silts and grass inside it and the gates are not working properly.
Future Utilization
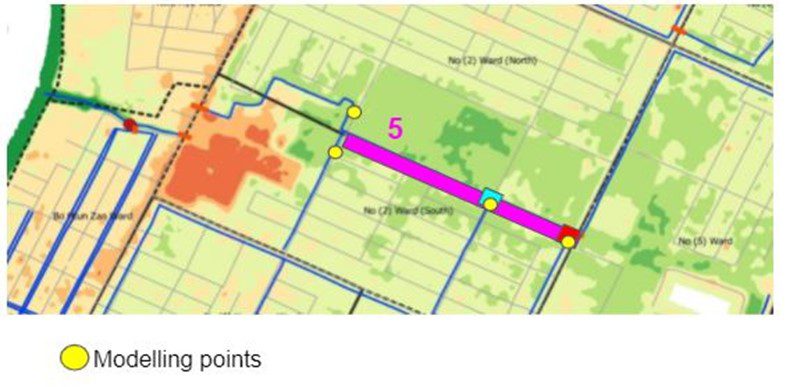
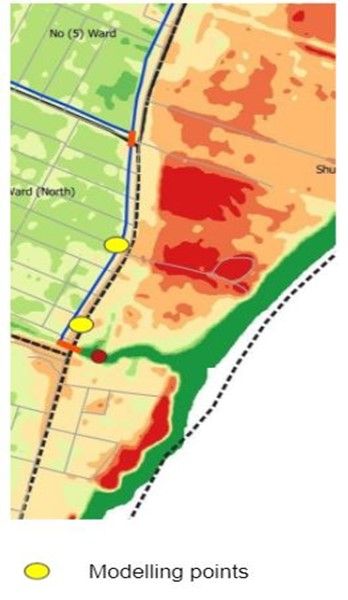
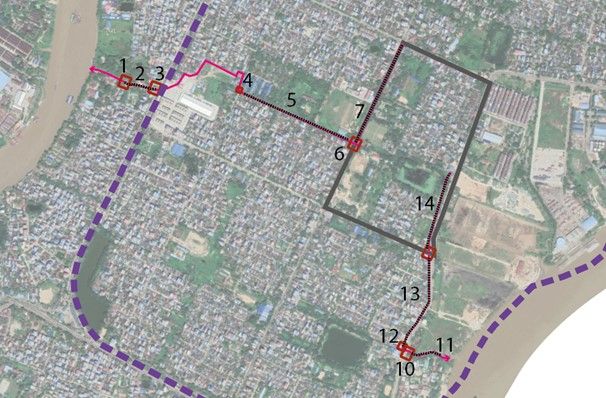
As mentioned above, one of the specific objectives of this measurement campaign is to support future works for the project team and Ward Officer/ YCDC. For this, the technical team used some of the measured data in calculation the capacity & design improvement of some drains/outlets which are a major contributing factor to extensive flooding around the reservoir in Ward 5, affecting many people on a day to day basis and having an impact throughout the year. Figure 3.9 gives an overview of the locations that need work.
- Improve design of the drains numbered as 5 & 7 (related to outlet 1) and 13 & 14 (related to outlet 4)
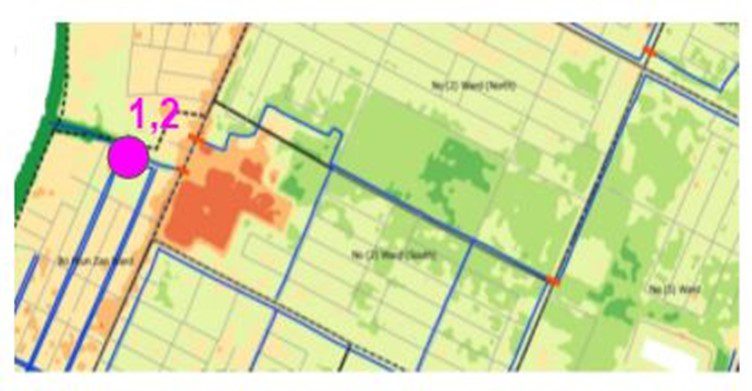
- Improvement of outlet 1 (marked as 1 in the figure below) en 4 (no. 10 in the figure):
- Improve operation of outlets, including negotiation with community
- Improve functioning (cleaning, maintenance works)
- Improvement of main culverts: no. 3, 4, 6, 12 in the figure below
Drains that can keep their current design and only need cleaning and maintenance are 2, 11 the drain underneath Fortune Plaza (between numbers 3 & 4) in the figure below.
For more detail: Work with YCDC on larger drains + outlets